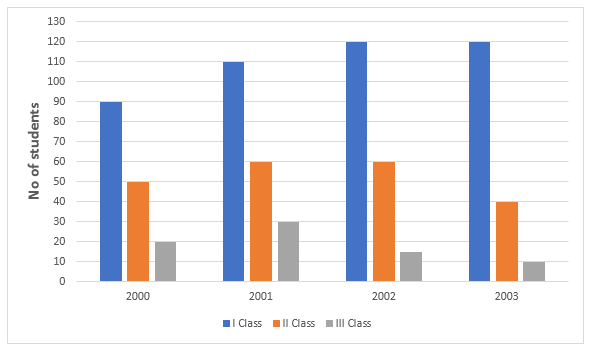
The given chart shows the number of students in Class 4, Class 5, Class 6 and Class 7 who got first class, second class and failed in the final examinations. Which class has least number of students who passed
AClass 4
BClass 5
CClass 6
DClass 7
The given chart shows the number of students in Class 4, Class 5, Class 6 and Class 7 who got first class, second class and failed in the final examinations. Which class has least number of students who passed
AClass 4
BClass 5
CClass 6
DClass 7
Related Questions:
The graph shows the result of 10th class students of a school for 4 years.
The year in which the maximum number of students appeared for the 10th class exam is:
50 കുട്ടികൾക്ക് ഒരു പരീക്ഷയിൽ ലഭിച്ച സ്കോറിനെ കുറിച്ചുള്ള വിവരങ്ങളാണ് താഴെ പട്ടികയിൽ കൊടുത്തിരിക്കുന്നത്
60 മുതൽ 69 വരെ സ്കോർ ലഭിച്ച എത്ര കുട്ടികളുണ്ട് ?
The total production of computers in 2013, 2015, and 2018 is x% of the total exports of computers by the company during the six years. The value of x is