A7:3
B8:5
C6:5
D7:6
A7:3
B8:5
C6:5
D7:6
Related Questions:
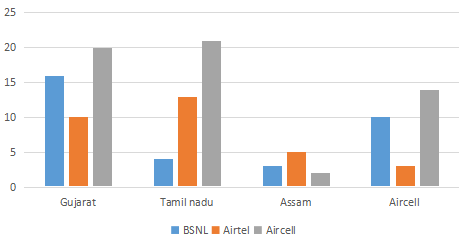
The number of mobile simcards in 4 states are given in multiple bar diagrams.In which state are there the largest number of owners of Airtel simcard ?#
The given chart shows the number of students in Class 4, Class 5, Class 6 and Class 7 who got first class, second class and failed in the final examinations.
Which class has the least number of students who passed?
The pie-chart shows the percentage-wise distribution of the number of students in five different schools P, Q, R. S and T. The total number of students in all five schools together is 10,500 The number of students in school R is what percent of the total number of students in schools Q and T together?
The pie-chart shows the percentage-wise distribution of the number of students in five different schools P, Q, R. S and T. The total number of students in all five schools together is 10,500 The difference between the central angles corresponding to schools T and R is