A12:7
B2:3
C17:14
D14:13
A12:7
B2:3
C17:14
D14:13
Related Questions:
Study the given bar chart and answer the question that follows. Production of Fertilizers by a Company (in 10,000 tonnes) Over the Years
What was the approximate percentage increase in the production of fertilizers from 1998 to 1999 ?
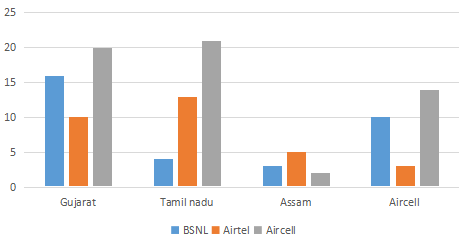
The number of mobile simcards in 4 states are given in multiple bar diagrams.In which state are there the largest number of owners of Airtel simcard ?#