Marks | number of students |
1 - 20 | 10 |
20 - 40 | 40 |
40 - 60 | 15 |
60 - 80 | 12 |
80 - 100 | 30 |
What is the ratio of the number of student between 20-40 and 80-100 marks?
A4 ∶ 3
B5 ∶ 3
C3 ∶ 5
D3 ∶ 4
Marks | number of students |
1 - 20 | 10 |
20 - 40 | 40 |
40 - 60 | 15 |
60 - 80 | 12 |
80 - 100 | 30 |
What is the ratio of the number of student between 20-40 and 80-100 marks?
A4 ∶ 3
B5 ∶ 3
C3 ∶ 5
D3 ∶ 4
Related Questions:
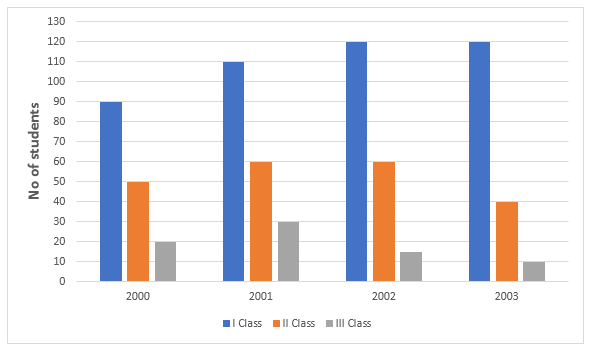
The graph shows the result of 10th class students of a school for 4 years.
The year in which the maximum number of students appeared for the 10th class exam is:
The given chart shows the number of students in Class 4, Class 5, Class 6 and Class 7 who got first class, second class and failed in the final examinations. Find the total number of students who failed in the examination
The given pie-chart represents the percentage of students enrolled in five different sports. The total number of students is 2800. Find the total number of students who play football and cricket