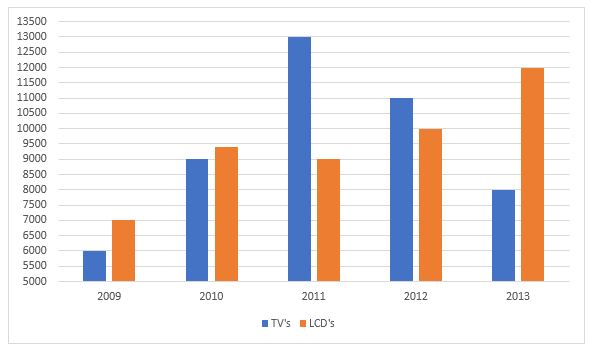
The number of the production of electronic items (TVs and LCDs) in a factory during the period from 2009 to 2013.The total number of products of electronic items is maximum in the year?
A2013
B2010
C2011
D2012
The number of the production of electronic items (TVs and LCDs) in a factory during the period from 2009 to 2013.The total number of products of electronic items is maximum in the year?
A2013
B2010
C2011
D2012
Related Questions:
The given pie-chart represents the percentage of students enrolled in five different sports. The total number of students is 2800.
If 24 students playing cricket are shifted to Kabaddi, then find the new ratio of the number of students in Cricket to those in Kabaddi.
The bar graph shows the number of cars sold by a distributor in each month from January to June.
How many more cars did he sell in the second quarter as compared to the first?
The given chart shows the number of students in Class 4, Class 5, Class 6 and Class 7 who got first class, second class and failed in the final examinations. Find the total number of students who failed in the examination