The given chart shows the number of students in Class 4, Class 5, Class 6 and Class 7 who got first class, second class and failed in the final examinations What is the pass percentage of Class 4?
A98%
B97%
C96%
D95%
The given chart shows the number of students in Class 4, Class 5, Class 6 and Class 7 who got first class, second class and failed in the final examinations What is the pass percentage of Class 4?
A98%
B97%
C96%
D95%
Related Questions:
Study the following table, which shows the number of units of a product manufactured and sold by a company in five years, and answer questions.
Years | Number of units (in thousands) Manufactured | sold |
2013 | 350 | 320 |
2014 | 375 | 315 |
2015 | 300 | 280 |
2016 | 450 | 423 |
2017 | 420 | 360 |
In which year the number of units of the product sold is 19000 less than the average number of units manufactured per year?
The given pie-chart represents the percentage of students enrolled in five different sports. The total number of students is 2800.
If 24 students playing cricket are shifted to Kabaddi, then find the new ratio of the number of students in Cricket to those in Kabaddi.
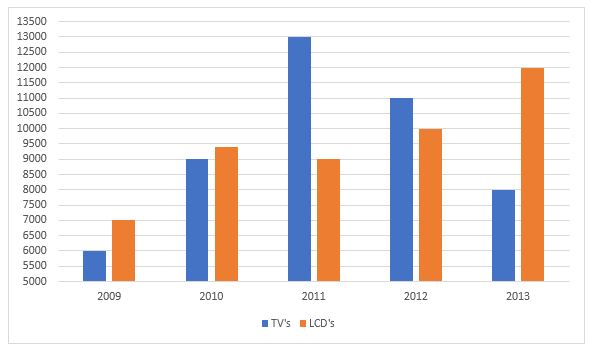
The number of the production of electronic items (TVs and LCDs) in a factory during the period from 2009 to 2013.The total number of products of electronic items is maximum in the year?
The line chart given below represents the revenue (in Rs. Crores) of a company for 6 years.What is the percentage decrease in the revenue from year 2011 to 2012?