The following pie chart shows the distribution of expenses (in degrees) of a family during 2016.
Total income of the family in 2016 = Rs. 1080000
Their expenditure on rent is what percentage of their expenditure on Education?
The following pie chart shows the distribution of expenses (in degrees) of a family during 2016.
Total income of the family in 2016 = Rs. 1080000
How much they spend (in Rs.) on clothes?
The bar graph given below represents the number of players of a college taking part in three games for 3 year.
Number of players playing football in 2016 is how much percent less than the players playing football in 2014?
Number of players playing hockey in 2015 is what percent of total players playing all the three games ?
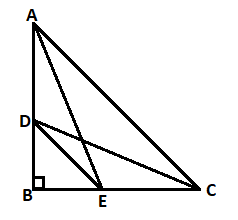
In the figure given below, B is a right angle. If DB = 6 cm, DC = 12 cm and AB = 14 cm, then find the length of AC.
Following two line-graphs represent the quantity of wheat and quantity of wheat and rice together sold from stores A, B, C and D.What is the respective ratio of quantity of rice sold from store B to the quantity of rice sold from store C and D together?
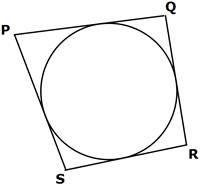
In the given figure, the circle touches the sides of the quadrilateral PQRS. If PQ = a and RS = b, express (PS + QR) in terms of a and b?