AOnly 2014
BOnly 2014 and 2017
COnly 2014 and 2015
D2014, 2015 and 2016
AOnly 2014
BOnly 2014 and 2017
COnly 2014 and 2015
D2014, 2015 and 2016
Related Questions:
In which year was the production of computers by the company 16% more than the average exports of computers in the six years (2013 to 2018)?
The pie-chart shows the percentage-wise distribution of the number of students in five different schools P, Q, R. S and T. The total number of students in all five schools together is 10,500 The difference between the central angles corresponding to schools T and R is
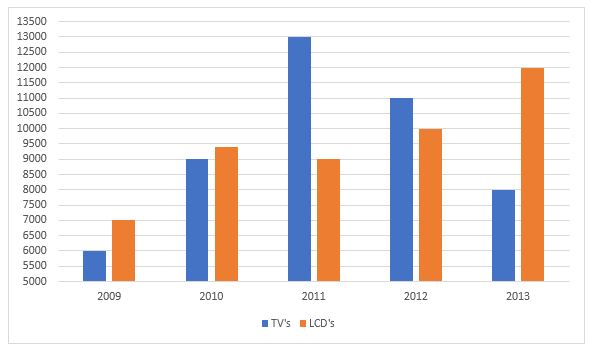
The number of the production of electronic items (TVs and LCDs) in a factory during the period from 2009 to 2013.The total number of products of electronic items is maximum in the year?
The line chart given below represents the revenue (in Rs. Crores) of a company for 6 years.What is the average revenue (in Rs crores) for given 6 years?