The graph shows the result of 10th class students of a school for 4 years.
The year in which the maximum number of students appeared for the 10th class exam is:
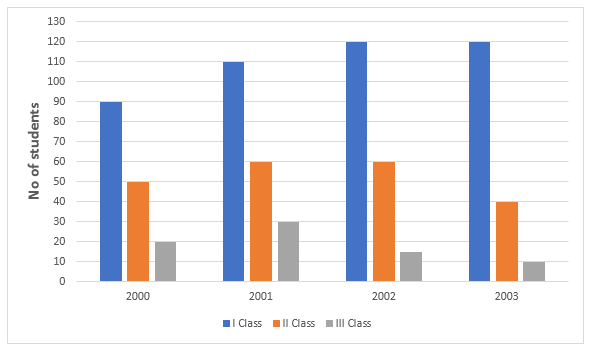
A2001
B2002
C2003
D2004
The graph shows the result of 10th class students of a school for 4 years.
The year in which the maximum number of students appeared for the 10th class exam is:
A2001
B2002
C2003
D2004
Related Questions:
The pie-chart shows the percentage-wise distribution of the number of students in five different schools P, Q, R, S and T. The total number of students in all five schools together is 10,500. Find the total number of students in schools Q and T together?
The pie-chart shows the percentage-wise distribution of the number of students in five different schools P, Q, R. S and T. The total number of students in all five schools together is 10,500 The number of students in school R is what percent of the total number of students in schools Q and T together?