App Logo

No.1 PSC Learning App

1M+ Downloads

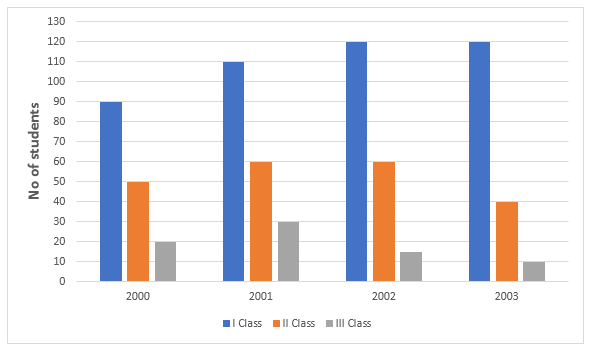
The given chart shows the number of students in Class 4, Class 5, Class 6 and Class 7 who got first class, second class and failed in the final examinations. Find the ratio of number of students who got first class in class 4 to second class in class 7

image.png

A9 : 5

B5 : 9

C9 : 7

D3 : 2

Answer:

A. 9 : 5

Read Explanation:

first class in class 4 : second class in class 7 = 45 : 25 = 9 : 5


Related Questions:

image.png

The line chart given below shows the profit percentage of a company on 5 different products P1, P2, P3, P4 and P5.

The expenditure of product P5 is Rs. 46000. What is the revenue of product P5?

image.png

The following pie diagram gives the marks scored by a student in different subjects in an examination. Assuming that the total marks scored by the student in the examination are 540, answer the question below

image.png

The subject in which the student scored 123 marks is:

image.png

Study the following carefully and answer the question.

image.png

For Company A , what is the approximate percentage decrease in production from 2015 to 2016?