A52220
B54440
C52640
D51600
A52220
B54440
C52640
D51600
Related Questions:
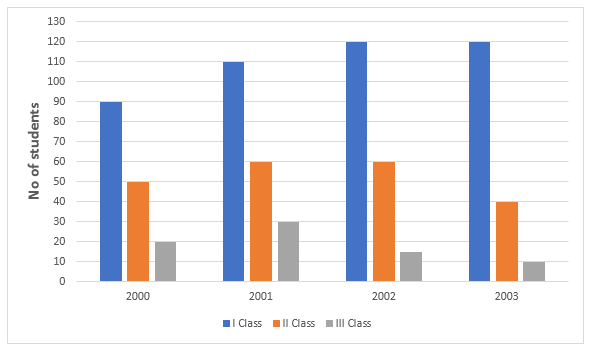
The graph shows the result of 10th class students of a school for 4 years.
The year in which the maximum number of students appeared for the 10th class exam is:
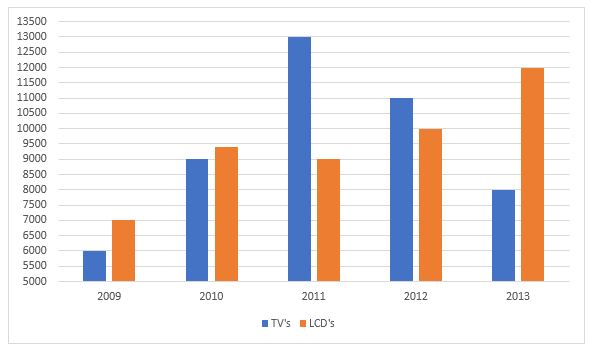
The number of the production of electronic items (TVs and LCDs) in a factory during the period from 2009 to 2013.The total number of products of electronic items is maximum in the year?