A2500
B3000
C2200
D2400
A2500
B3000
C2200
D2400
Related Questions:
The following pie-chart shows the number of students who failed in different subjects in an examination, Examine the chart and answer the following questions. The total number of students who have failed in 500.

The number of students failed in science is less than the number of students failed in all other subjects by:
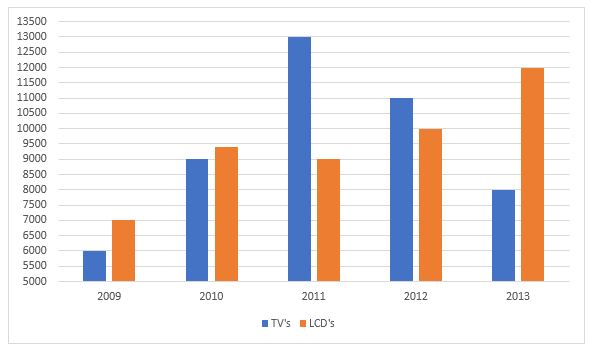
The number of the production of electronic items (TVs and LCDs) in a factory during the period from 2009 to 2013.The total number of products of electronic items is maximum in the year?