The graph shows Income and Expenditure(Rs. in lakhs) of a company.The number of years in which the income exceeds the average income is :

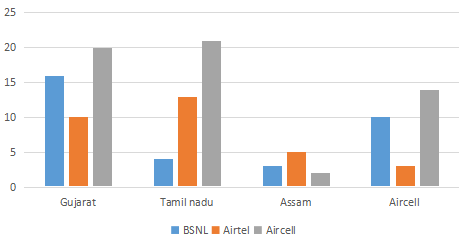
The number of mobile simcards in 4 states are given in multiple bar diagrams.In which state are there the largest number of owners of Airtel simcard ?#
The graph shows Income and Expenditure(Rs. in lakhs) of a company.The expenditure from 2002 to 2003 increased by:
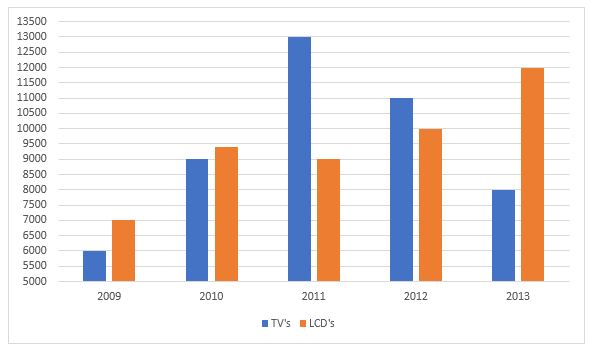
The number of the production of electronic items (TVs and LCDs) in a factory during the period from 2009 to 2013.The total number of products of electronic items is maximum in the year?
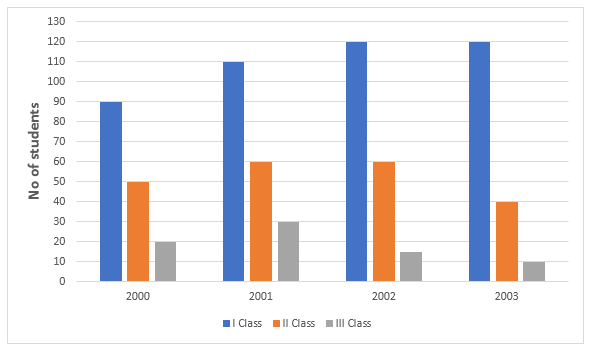
The graph shows the result of 10th class students of a school for 4 years.
The year in which the maximum number of students appeared for the 10th class exam is:
The following pie-chart shows the number of students who failed in different subjects in an examination, Examine the chart and answer the following questions. The total number of students who have failed in 500.

The number of students failed in science is less than the number of students failed in all other subjects by:
The line chart given below represents the revenue (in Rs. Crores) of a company for 6 years.What is the percentage decrease in the revenue from year 2011 to 2012?
The line chart given below represents the revenue (in Rs. Crores) of a company for 6 years.What is the average revenue (in Rs crores) for given 6 years?
The bar graph given below represents revenue of a firm for 8 years. All the revenue figures have been shown in terms of Rs. crores.By what percentage has the revenue of the firm decreased in 2010 with respect to the last year.
The bar graph given below represents revenue of a firm for 8 years. All the revenue figures have been shown in terms of Rs. crores.What is the total value of revenue of the firm (in crores Rs.) in years 2010, 2011 and 2012?
The given pie chart shows the breakup (in percentage) of monthly expenditure of a person.If the total salary of the person is Rs 50000, then what will be the expenditure (in Rs) on Rent?
The given pie chart shows the breakup (in percentage) of monthly expenditure of a person.If the expenditure incurred on Clothes is Rs 3000, then what is the expenditure (in Rs) incurred on Education?
The given pie chart shows the breakup (in percentage) of monthly expenditure of a person.The central angle made by the sector of expenditure on Fuel is how much (in degrees) if the ratio of the expenditure on Fuel and Clothes is 4 : 3 respectively?
The line graph given below represents the runs scored by Kohli and Sharma against 5 teams.What is the difference between the total runs scored by Kohli against the teams Q and R and total runs scored by Sharma against the teams Q and R?
The line graph given below represents the runs scored by Kohli and Sharma against 5 teams.Total runs scored by Sharma against 5 teams is what percent of total runs scored by Kohli against 5 teams?
The following pie chart shows the distribution of expenses (in degrees) of a family during 2016.
Total income of the family in 2016 = Rs. 1080000
Their expenditure on rent is what percentage of their expenditure on Education?
The following pie chart shows the distribution of expenses (in degrees) of a family during 2016.
Total income of the family in 2016 = Rs. 1080000
How much they spend (in Rs.) on clothes?
The bar graph given below represents the number of players of a college taking part in three games for 3 year.
Number of players playing football in 2016 is how much percent less than the players playing football in 2014?